Zutae
A local-first memory app: notes, browsing and Claude Code sessions in one place, searchable from Claude Code.
What it is
Zutae is the notes app I open every day, with two more inputs feeding it. A Chrome extension records which site has focus, and a Claude Code hook sends each finished coding session. Everything goes to a server on my Mac, which indexes it for search, extracts dated facts into a knowledge graph, and counts where the hours went.
There are three ways in. The editor is a block editor in the style of Notion, with a ⌘K palette that searches page titles, note text and images together. The Analysis page shows a day, week, month or year by category, next to the period before. And Claude Code reads and writes the same memory through MCP, so a session can look up last month's notes or save its findings as a new page.
Every model runs locally. From 12 July to 1 November 2026 it collected 152 pages, 1,447 uploaded files, 855 Claude Code sessions, and 374,714 browser events across 112 days. The code is private for now.
How it's built
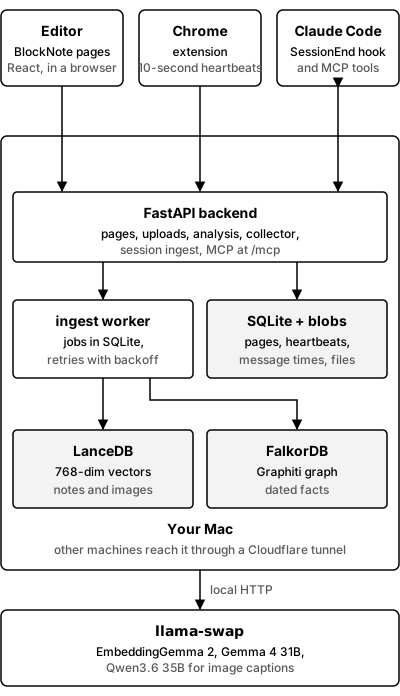
One process on the Mac, three inputs, and models served on the same machine.
The backend is one FastAPI process, run by launchd. It serves the built frontend, the page and file
API, the Analysis endpoints, the collector, session ingest, and an MCP server built on FastMCP and mounted
at /mcp. SQLite holds pages, blocks, heartbeats and Claude Code message times. Uploaded files go into a
blob store by content hash. From other machines, a Cloudflare tunnel with Access in front reaches the same
process.
Ingest is a job queue in SQLite, worked by a task inside the same process. Saving a page queues a job; the worker embeds the changed blocks, writes a caption for each image or video, and sends the page to the graph. A failed job retries with backoff that doubles each time, capped at five minutes, and after six attempts it is marked failed and logged. Jobs left running by a crash are requeued at startup. Of 15,740 jobs so far, 15,672 finished and 68 failed.
The models all run through llama-swap on the Mac. EmbeddingGemma 2 embeds note text, graph facts and images into one 768-dimension space. Gemma 4 31B writes the digests and extracts facts for Graphiti. Qwen3.6 35B writes image captions, so a photo can be found by what is in it.
Digests turn raw input into something worth searching. Each Claude Code session becomes a 3 to 6 sentence summary. Every 30 minutes, a launchd job turns new browsing into a short daily digest of sites, videos and articles. Both are embedded and added to the graph as dated episodes. Early on Sunday morning, another job rewrites four profile pages from the week's material: strengths and weaknesses, people, projects, and interests. Questions like "what have I been working on" need an answer that spans many notes, and a top-k search can't give one.
MCP exposes nine tools: semantic search, graph search, notes by date range, browsing by date range, the profiles, and create, update and delete for documents, plus an older ingest tool kept for old clients. A Markdown body becomes editor blocks, including tables, Mermaid diagrams and images.
About 6,500 lines of Python in the backend, 4,300 lines of TypeScript in the frontend and 1,300 in the extension, with 92 backend tests. 86 commits since the first one on 12 July 2026.
Two decisions behind it
One embedding space for notes, images and facts
Until October, images had their own model, Ovis-VL-Embedding-2B, with 2,048-dimension vectors in a separate index. EmbeddingGemma 2 can embed text and images into the same space, so I tested it on Zutae's own data before switching. Matching a video title to its thumbnail across 924 YouTube thumbnails, it put the right one first 51% of the time, against 39% for Ovis. One query vector can now find notes and images together, which is what the ⌘K palette does.
The cost was Korean note search. On 44 real queries I labelled by hand, it found the right note first 64% of the time, where the previous text model, nomic, managed 73%. I took that loss to run one model for everything.
A page is one graph episode, replaced on every save
Graphiti extracts facts from episodes. Sending each block as its own episode would give the extractor fragments with no context, so the whole page goes in as one episode, dated with the page's last edit. On the next save, the new episode is written first and the old one is removed, so a page edited fifty times doesn't leave fifty copies of its facts in the graph.
Writing the episode and recording its ID are two separate steps, so a crash between them leaves an episode nothing points to, which keeps stale facts alive. Once the graph is reachable after each start, the worker looks for note, activity and chat episodes that no page claims and removes them.
The hard problem: counting each moment once
The Analysis page answers "where did my time go?", and the answer is only useful if the hours add up. Two sources overlap all the time. I read docs in Chrome while Claude Code works in another window, and two or three Claude Code sessions often run at once in different folders. Adding up each source's time would report more hours than the day has.
So time is counted in 10-second slots, and each slot belongs to exactly one thing.
- The extension sends a heartbeat every 10 seconds, but only when a Chrome window has focus, the tab isn't incognito, and there has been keyboard or mouse input within the last 60 seconds. A video playing unmuted in the visible tab keeps it counting while idle.
- A Claude Code session claims the slots between two of its messages when they are at most 5 minutes apart. A longer gap counts as a break.
- When sessions overlap, the one that started later takes the shared slots.
- When a browser heartbeat and a Claude Code session claim the same slot, the browser wins, since that is where my attention was.
def claude_slots(messages, idle_gap_s):
    sessions = groupby(messages, key=lambda m: m[0])
    spans = sorted(chain.from_iterable(
        _session_spans(g, idle_gap_s) for _, g in sessions
    ))
    return {
        slot: ("project", cwd)
        for a, b, cwd in spans
        for slot in range(int(a) // SLOT_SECONDS,
                          int(b) // SLOT_SECONDS)
    }


def merge_slots(browser, claude, window):
    return clip_slots({**claude, **browser}, window)
Spans are sorted by start time, so a later span overwrites the slots it shares with an earlier one. The merge puts browser slots last for the same reason. Each slot then maps to a site or a folder, and editable rules map those to at most eight categories. A site rule covers its subdomains, a folder rule covers its subfolders, and the longest matching rule wins.
The same slots feed the other numbers on the page: the longest focused run, runs of 25 minutes or more, category switches per active hour, the day's span measured from 05:00 to 05:00, a weekday-by-hour heatmap, and progress toward hour goals per category. Because they all come from one slot map, they agree with the main chart.
YouTube needed its own fix. The extension's playback events report media seconds, which run faster than the clock at 1.5x speed, and an event can start before a long pause. Video time now comes from focused heartbeats on watch and Shorts pages, and the playback events are only used to find each video's channel.
What it still misses. Only Chrome and Claude Code are seen, so time in Xcode, a plain terminal or any other app counts as nothing. A Claude Code session counts gaps of up to 5 minutes between messages, even if I walked away during them. When sessions overlap, the earlier one loses the shared slots in the main chart; parallel-session time is reported separately but not split between folders. And the Analysis layout has not been checked at phone width or in light mode.